US Wealth Distribution
Asked CHAT GPT to discuss this chart:
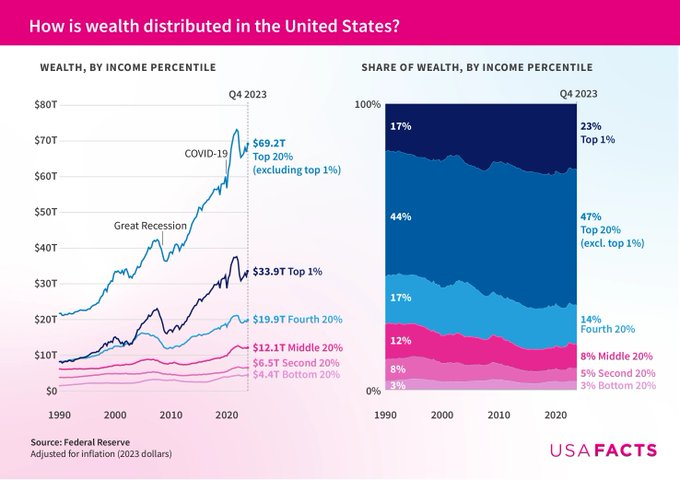
The graph from USAFacts, based on Federal Reserve data adjusted for inflation (2023 dollars), provides a detailed overview of wealth distribution in the United States as of Q4 2023, with two primary charts: "Wealth, by Income Percentile" and "Share of Wealth, by Income Percentile."
### Insights:
#### Wealth, by Income Percentile (Left Chart):
1. Top 1%:
- The wealth of the top 1% has significantly increased, reaching $33.9 trillion in Q4 2023.
- There was a noticeable spike around the COVID-19 period, suggesting that the top 1% gained substantial wealth during the pandemic.
2. Top 20% (excluding top 1%):
- This group holds the majority of the wealth, amounting to $69.2 trillion in Q4 2023.
- The trend shows a steady increase in wealth over time, with a marked increase post-Great Recession and during the COVID-19 period.
3. Fourth 20%:
- The fourth 20% (60-80th percentile) holds $19.7 trillion.
- The growth is steady but much slower compared to the top 20%.
4. Middle 20%:
- The middle 20% (40-60th percentile) has $12.1 trillion.
- The increase is minimal and relatively flat, indicating limited growth in wealth over the years.
5. Second 20%:
- The second 20% (20-40th percentile) possesses $6.5 trillion.
- Similar to the middle 20%, the wealth growth is slow and flat.
6. Bottom 20%:
- The bottom 20% (0-20th percentile) holds $4.47 trillion.
- This group shows the least growth in wealth, remaining relatively stagnant over time.
#### Share of Wealth, by Income Percentile (Right Chart):
1. Top 1%:
- The top 1% now holds 23% of the total wealth in the United States, up from 17% in 1990.
- This demonstrates an increasing concentration of wealth among the richest individuals.
2. Top 20% (excluding top 1%):
- This group's share has increased from 44% in 1990 to 47% in 2023.
- It underscores the significant wealth held by the upper echelons of society, excluding the top 1%.
3. Fourth 20%:
- The share of wealth held by this group has remained relatively stable around 14%.
4. Middle 20%:
- Their share has decreased slightly, now at 8%, indicating a relative loss in wealth compared to higher percentiles.
5. Second 20%:
- The share has declined slightly to 5%, showing marginally reduced wealth concentration in this group.
6. Bottom 20%:
- The bottom 20% continues to hold 3% of the total wealth, indicating persistent economic inequality.
### Key Takeaways:
- Increasing Wealth Inequality:
The top 1% and top 20% (excluding the top 1%) have seen significant gains in their share of wealth, particularly during and after economic crises like the Great Recession and COVID-19.
- Stagnation for Lower Percentiles:
The middle, second, and bottom 20% have seen relatively little growth in wealth, and their share of the total wealth has either remained flat or decreased slightly, highlighting the challenges of economic mobility for these groups.
- Economic Crises Impact:
The periods of economic crises (Great Recession and COVID-19) appear to have exacerbated wealth disparities, benefiting the wealthiest individuals significantly more than others.
### Conclusion:
The data reveals a pronounced and growing wealth inequality in the United States, with wealth increasingly concentrated in the hands of the top percentiles. This trend suggests that policies aimed at reducing inequality and promoting wealth distribution across all income levels may be necessary to address these disparities.