VIX - Volatility Index
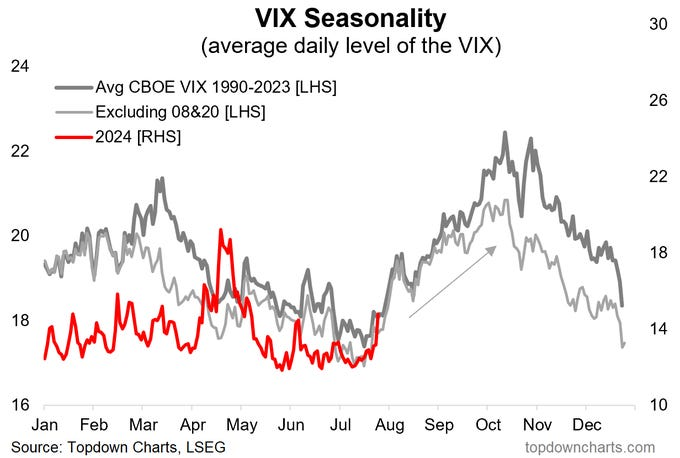
Volatility in rates, markets, etc. always increases in the second half of the year.
ChatGPT:
The VIX, or Volatility Index, is a real-time market index representing the market's expectations for volatility over the coming 30 days. It is derived from the prices of S&P 500 index options and is often referred to as the "fear gauge" or "fear index." Here’s a detailed breakdown:
### What the VIX Measures
1. Market Sentiment: The VIX measures the market's expectation of volatility. High values indicate high expected volatility (often associated with fear or uncertainty), while low values indicate low expected volatility (associated with market calm).
2. Expected Volatility: Specifically, it quantifies the expected annualized change in the S&P 500 index over the next 30 days. For example, a VIX level of 20 implies an expected annualized volatility of 20%.
### How the VIX is Calculated
1. Options Prices: The VIX is calculated using the prices of a wide range of S&P 500 index options. Both call and put options are used to estimate expected volatility.
2. Formula: The calculation involves a complex formula that combines the prices of multiple options to estimate the volatility of the S&P 500 index over the next month. The basic idea is to take a weighted average of the implied volatilities of options at different strike prices.
### Why the VIX is Important
1. Market Indicator: The VIX is a key indicator for traders and investors to gauge market sentiment. A rising VIX often signals increasing fear or uncertainty, while a falling VIX suggests a calmer market.
2. Risk Management: Investors and portfolio managers use the VIX to make decisions about hedging strategies. For example, a high VIX might prompt an investor to buy protective puts to hedge against potential market declines.
3. Investment Products: There are various financial products, such as VIX futures, options, and exchange-traded products (ETPs), that allow investors to trade based on the VIX. These products are often used to hedge against or speculate on changes in market volatility.
### Historical Context
- Financial Crises: The VIX tends to spike during periods of financial crisis or major market events. For instance, it saw significant increases during the 2008 financial crisis, the 2011 European debt crisis, and the COVID-19 pandemic in 2020.
### Practical Applications
1. Hedging: Investors use VIX-related products to hedge their portfolios against market downturns. By holding positions in VIX futures or options, they can offset losses in their equity holdings during volatile periods.
2. Speculation: Traders may also speculate on the direction of market volatility using VIX products. For example, a trader might buy VIX call options if they expect a surge in market volatility.
### Interpreting VIX Levels
- Below 20: Indicates low volatility and a generally stable market.
- 20-30: Moderate volatility, often seen during periods of market uncertainty.
- Above 30: High volatility, typically associated with significant market stress or fear.
### Conclusion
The VIX is a vital tool for understanding and navigating market volatility. By providing a real-time measure of expected market volatility, it helps investors make informed decisions about risk management and trading strategies. Whether you're looking to hedge against potential market drops or speculate on future volatility, the VIX offers valuable insights into market dynamics.
If you have any further questions or need more detailed information on a specific aspect of the VIX, feel free to ask!