Yield Curves
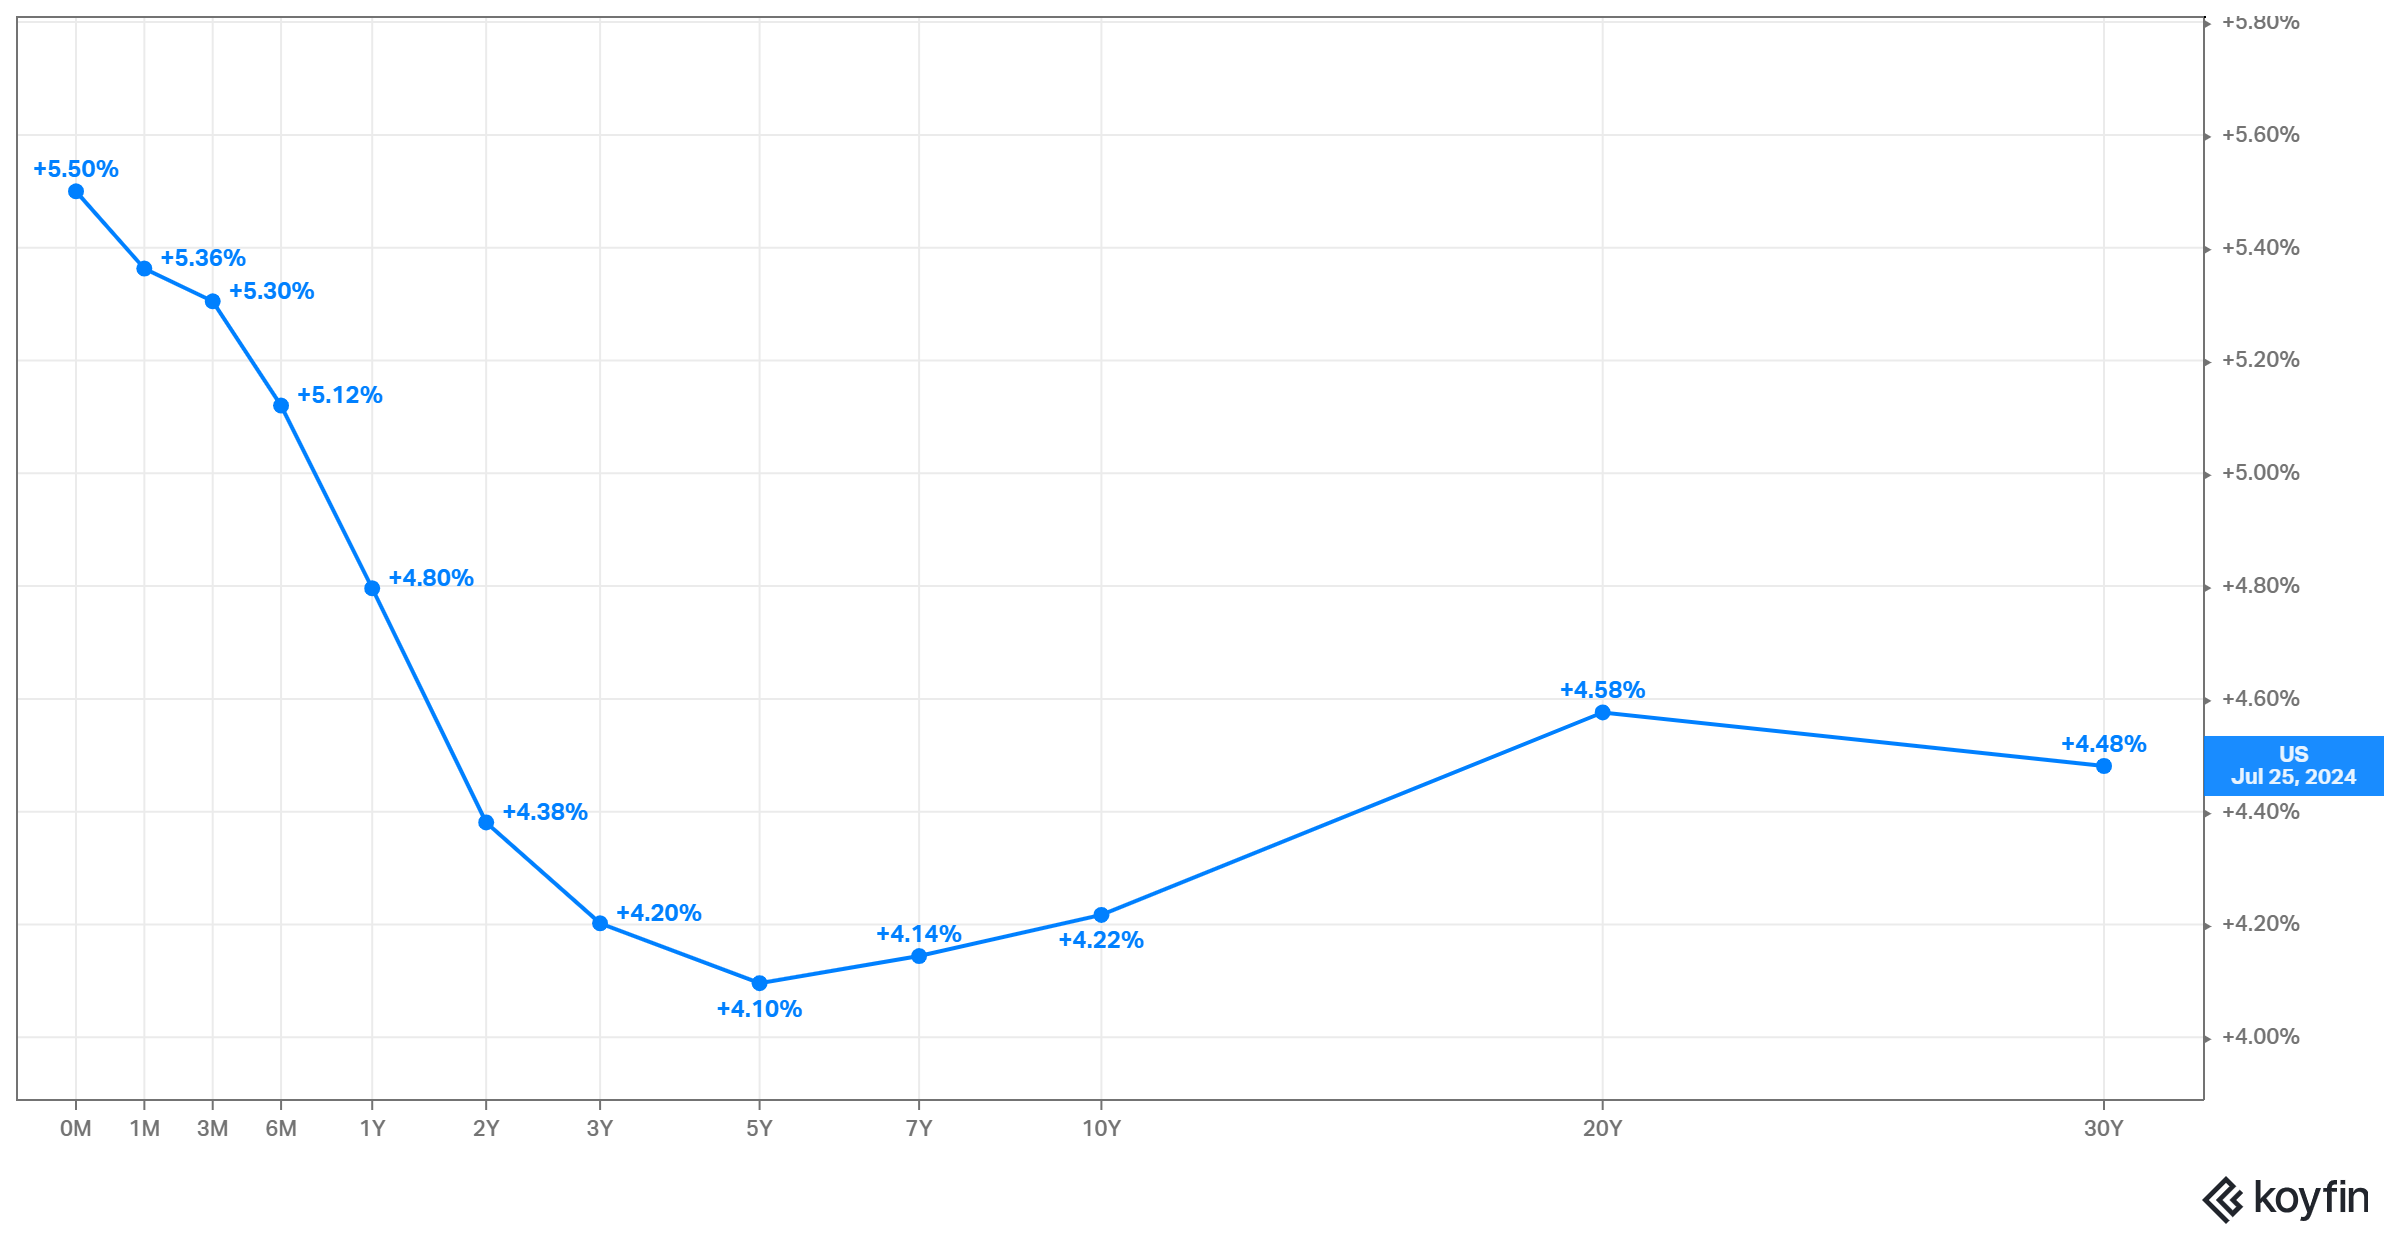
What is a Yield Curve?
A yield curve is a graphical representation that shows the relationship between the interest rates (or yields) of bonds having equal credit quality but differing maturity dates. Typically, the yield curve is used to represent government bonds (such as U.S. Treasury securities).
Key Points on Yield Curve:
X-Axis (Horizontal): Represents the time to maturity of the debt instruments, from short-term to long-term.
Y-Axis (Vertical): Represents the yield (interest rate) offered by the debt instruments.
Types of Yield Curves:
Normal Yield Curve: Upward sloping, indicating higher yields for longer-term bonds compared to short-term bonds. This suggests a growing economy.
Inverted Yield Curve: Downward sloping, indicating lower yields for longer-term bonds compared to short-term bonds. This often suggests an upcoming recession.
Flat Yield Curve: Little difference in yields across maturities, suggesting economic uncertainty or transition.